Here’s How The Rising Stablecoin Supply Is Shaping Bitcoin’s Price Performance
Stablecoins are now emerging as a pivotal force, particularly influencing Bitcoin’s recent price movements. Data from the on-chain analytics firm Glassnode reveals a notable shift in the stablecoin supply ratio (SSR) oscillator, signaling an increase in stablecoin “buying power.”
This trend has become a significant factor contributing to Bitcoin’s price performance.
Stablecoin Supply Moves 3.5% Higher
The SSR oscillator, a critical tool in understanding supply and demand dynamics between “BTC and USD,” has exhibited a marked decline. This decrease indicates that stablecoins currently possess enhanced purchasing power to acquire Bitcoin, according to Glassnode.
From a peak of 4.13 in October, the SSR oscillator has dropped sharply to just 0.74 as of January 22. This shift aligns with Bitcoin’s ascent to two-year highs above $48,000 this month, suggesting a direct correlation between stablecoin supply trends and Bitcoin’s bullish trajectory.
James Van Straten, a research and data analyst at CryptoSlate, has highlighted a significant increase in stablecoin supply starting from Q4 of 2023, a trend that has continued into the new year.
As we saw last week with the rotation of stablecoins moving into #Bitcoin, that sent BTC above 42k.
Stablecoin supply is now 10B higher from the low, and 3.5% higher in the past 30 days. https://t.co/QIq2sEA9yg pic.twitter.com/YFcSzZhan8
— James Van Straten (@jvs_btc) January 31, 2024
Notably, according to the data, this expansion contrasts with the pullback in stablecoin supply observed from May 2022 until October 2023.
Bitcoin’s Recovery Amid Stablecoin Influx
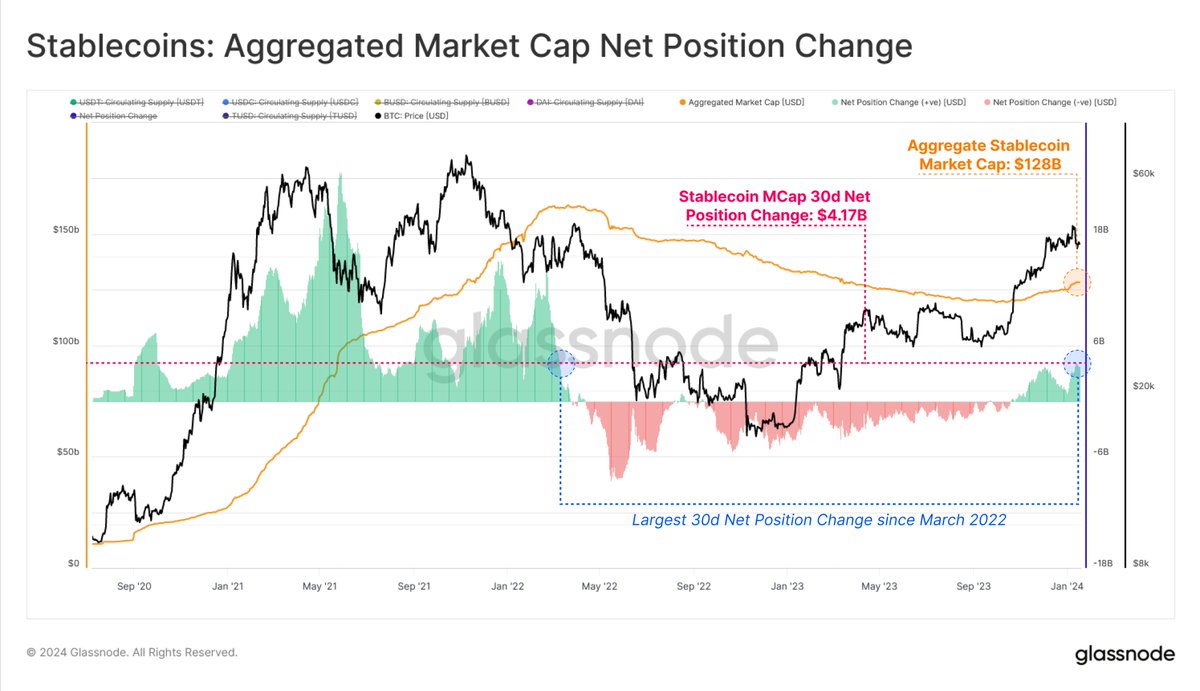
Meanwhile, recent reports indicate that stablecoins have amassed more than $4 billion in inflows over the past month. The Glassnode data underscores this expansion, with the aggregate supply of major stablecoins like Tether (USDT), USD Coin (USDC), Dai (DAI), and TrueUSD (TUSD) experiencing substantial growth since last October.
The “aggregated market cap net position change” metric, which tracks the monthly changes in the total stablecoin supply, has shown positive values, indicating this increase.
The most recent data point to a $4.17 billion increase in the 30-day net position change, marking the largest rise in the stablecoin market cap since March 2022. With these inflows, the combined market cap of these fiat-tied tokens stands at roughly $128 billion.

Amid this influx of stablecoin capital, Bitcoin has shown resilience and recovery from its recent price dips. While the asset’s daily trading volume has ranged below $25 billion in the past week, over this same period, the leading crypto has rebounded by nearly 10% in price, trading above $42,500 at the time of writing.
This recovery, albeit with a minor dip in the last 24 hours, underlines Bitcoin’s responsiveness to the shifting landscape in the stablecoin market.
Featured image from Unsplash, Chart from TradingView
from Bitcoinist.com https://ift.tt/PC5gDX4
via IFTTT